Power curves of A17

leman

Site Champ
Posts
641
Reaction score
1,196
We started this discussion in the iPhone 15 thread but I think it makes sense to make it a separate topic. To give a brief recap, I wrote a simple tool that loads up the CPU cores on Apple devices and measures their power draw and CPU frequency. You can find this tool here: https://github.com/mr-mobster/AppleSiliconPowerTest and feedback as well as test results on more devices are very appreciated!

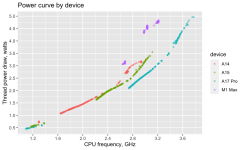
With the new data on running multiple threads and fixing some bugs in how I analysed it, the samples now cover a nice range of frequencies on several devices. Putting it on a plot, we get a fairly neat approximation of power curve of multiple Apple CPUs.

1695800138515.png


Some basic observations. At 3Ghz, A17 uses about 0.5 watts (or 15%) less power than A14/A15. At 3.5 watts, A17 runs around 7% faster than A15. At 5 watts, A17 gains 0.5Ghz on Firestorm (that's 15% better performance at the same power). At 3.6 Ghz, A17 uses ~ 20% less power than M2. On the other hand, A16 and A17 are very close, which again aligns with the results by Geekerwan (IMO it makes sense as A16 is an efficiency-focused design for high-end smartphones).

It does look to me like A17 aims to improve the relative efficiency at higher frequencies (>3Ghz/3 watts) compared to A15 which looks like it targets improved efficiency at around 2.8-3Ghz/2.5 watts. I think gives addition credibility to the idea that Coll (Apple's new CPU architecture) has been developed with high-performance desktop in mind.

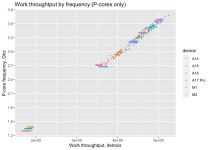
Here is the work throughput for used power (combined P+E core use, take with a grain of salt)

1695805208584.png


And probably my favourite graph, predicted power/frequency curve for A17! This uses a polynomial of fourth degree to predict power usage from frequency (going higher does not improve the fit).

1695805261729.png


Next steps:

- A14 graph looks a bit weird, might want to collect more samples from other devices
 

Attachments

  • 1695761097902.png
    1695761097902.png
    109.7 KB · Views: 100
Last edited:

Cmaier

Site Master
Staff Member
Site Donor
Posts
5,329
Reaction score
8,521
A17 Pro CPU core code names:
  • P = Coll
  • E = ider
;^p

I’ve seen worse. (I was particularly adverse to the mid-1990’s trend of naming chips after Alaskan national parks…)
 

leman

Site Champ
Posts
641
Reaction score
1,196
But does thread power only include the core? A thread cannot do much of anything without involving the memory hierarchy. If you have more efficient memory subsystems, thread power night go down without it being reflected in core power usage.

Apple performance controller tracks the energy and CPU usage per thread, I use this data to estimate the frequency and average power by core type. These are of course approximations. And I don’t how Apple measures this, whether it’s just CPU or caches also get into the mix. For what its worth there is not much data transfer, just some shared counters to measure progress.

The test workload I use is very basic (it’s just a nested loop with some integer division and branches), but it appears to do a decent job loading up the CPU. At any rate, the frequency estimates match those of peak usage when running much more demanding tests.
 

leman

Site Champ
Posts
641
Reaction score
1,196
If no one gets to it by this weekend, I’ll run it on my M2 MacBook Air. Can’t do it during the week unless I get some unexpected extra time for some reason.

Will keep you posted if I need more data! Thanks for the offer!
 

Altaic

Power User
Posts
142
Reaction score
180
Updated the charts with M2 and A16 devices, as well as more M1 data! One can really see how A17 improves the power efficiency at higher frequencies compared to M2.
Holy hell, that new chart is shockingly awesome wrt the A17 compared to the M2! Would you post an updated perf/freq chart (the one that looked practically linear), please?

Edit: My takeaway is that the A16 is an amazing design, and the A17 properly extends it. More thermal headroom (e.g. in a laptop or desktop) will be something to witness.
 
Last edited:

leman

Site Champ
Posts
641
Reaction score
1,196
Would you post an updated perf/freq chart (the one that looked practically linear), please?

Done (keep in mind that this is combined P+E core use, so there is a lot of variance)!

Also added a prediction for A17 freq/power curve
 

Altaic

Power User
Posts
142
Reaction score
180
Ah, I was talking about an updated perf/freq chart rather than power/perf, like this one you posted:

1695805742284.png


Edit: Just curious where and how the different SoCs overlap.
 

leman

Site Champ
Posts
641
Reaction score
1,196
Ah, I was talking about an updated perf/freq chart rather than power/perf, like this one you posted:

Ah, sorry, here it is. Didn't get the A13 tested yet, but I have no doubt it will have half the the throughput at the same frequency. As you can see, the behavior of all cores is identical. The jitter is there because threads move between P- and E-cores, and it is not possible to differentiate on which core the work was done. For this graph I only considered threads with at least 90% of the time spent on the P-core, but it's the small mix to E-core that jitters the data around.


1695812426005.png
 

Attachments

  • 1695812296219.png
    1695812296219.png
    116.1 KB · Views: 13

dada_dave

Elite Member
Posts
2,164
Reaction score
2,148

@dougall Regarding the low IPC increases on A17, I have a suspicion. In the (admittedly naive) stress tests I did, A17 was only able to maintain its peak frequency for only few seconds at most. After 10 seconds the frequency was consequently below 3.6 Ghz (and above 3.5Ghz). 
If A17 behaves similarly when running benchmarks, it is possible that we are overestimating the frequency it is running at. If the average clock is lower, real IPC improvements might be higher than estimated.

@leman what do you think?
 

Cmaier

Site Master
Staff Member
Site Donor
Posts
5,329
Reaction score
8,521


@leman what do you think?
I saw this too, and I am unclear as to what it means - is his point that the benchmarks false report 3.6GHz because they only sample the frequency once? I don’t know how the benchmark tools work, but that would be weird.
 

theorist9

Site Champ
Posts
613
Reaction score
563
I'll add my own modeling of @leman's frequency vs. power data for the A17 Pro Performance Core (single thread):

The basic theoretical models for frequency vs. power follow a power law (real-world is obviously more complicated), so I started by looking for that. The easiest way to check if your data follows a power law (something of the form f(x) = a x^b) is to plot it on a log-log plot, and see if it follows a straight line (log-log plots linearize power laws). If it does, the slope will be equal to the value of the exponent.

When I did that, I didn't see a single straight line, but rather what appear to be three different scaling regimes. Fitting each of these to its own simple power law gave these results:

Low Frequency (1.09 GHz to 1.34 GHz, 344 data points, green): p(f) = 0.4 * f^1.2
Middle Frequency (2.73 GHz to 3.38 GHz, 295 data points, blue): p(f) = 0.2* f^2.4
High Frequency (3.45 GHz to 3.78 GHz, 55 data points, red): p(f) = 0.07 * f^3.2

Note1: I've rounded all the parameter values in this post for readability, but because of the sensitivity of these equations to those values (especially the equations shown later), you won't be able to recover these plots from these equations—you'll need a lot more digits. If anyone wants these, LMK, and I'll add them to this post.

Note 2: All equations were fitted using Mathematica's NonlinearModelFit function, with a Weighted Least Squares (WLS) minimization, and a (probably excessive) internal precision of 100 digits (to avoid rounding errors). For more details, see "Note 2, extended", at bottom.

1697047867132.png


If we expand the graph, we find the high-frequency curve extrapolates to 13 watts at 5 GHz:

1697047912486.png

Now you might argue, reasonably, that when you go from 4 GHz to 5 GHz, yet another scaling regime will come into effect, with an even higher slope, leading to a power consumption >13 watts at 5 GHz. And that's essentially what leman got when he fit the whole curve, which is effectively a prediction of how the scaling exponent will continue to increase as the frequency increases (yielding a predicted power consumption of 15 watts at 5 GHz).

So given that we have no knowledge of what the next scaling exponent will be, a polynomial fit, like what leman did, seems the best we can do at this point.

Having said that, just for fun, we can play with math to see if we can get a good overall fit with fewer paramaters than what leman used as a starting point. IIUC, he fit the data to a polynomial of the form:
p(f) = a + b f + c f^2 + d f^3, + e f^4. I.e., his model uses five parameters.

With a polynomial, the simplest equation I managed to find that gave a good fit had three parameters:
p(f) = 0.2 + 0.2 f^2 + 0.0006 f^6. Like leman's equation, this predicts 15 watts at 5 GHz. It's plotted immediately below.

Note that, unlike my first model, this one isn't directly physical (I don't think there is any f^6 power scaling going on); it's simply the math that gives the best polynomial fit with the fewest parameters (that I could find). I also don't think leman's quartic model is directly physical either—while it nicely tracks the values, I don't see any evidence of f^4 power scaling in this data. [Yes, given the trend, it may not be surprising to see that in the next scaling regime, since thus far we've gone from 1.2⟶2.4⟶3.2; but it's not present in this data.]

I.e., I think the best way to understand these two polynomial equations (my sixth-power and leman's quartic) are that they use a single higher-order polynomial to model what's actually going on, which is a successively-increasing set of lower-order power law behaviors. This also applies to the exponential I show at the end.

Note: The following are linear (i.e., not log-log) plots, which is why you can see the curve.

p(f) = 0.2 + 0.2 f^2 + 0.0006 f^6
1697048048965.png

If one is willing to accept a modest reduction in quality-of-fit, one can reduce the number of parameters even further, to two, using an exponential. The exponential is a bit stronger than the polynomial, giving a predicted power of 16 w at 5 GHz:

p(f) = 0.2 e^(0.9 f)

1697048165943.png


Note 2, extended: All equations were fitted using Mathematica's NonlinearModelFit function, with Weighted Least Squares (WLS) minimization. Specifically, instead of minimizing the sum of the squares of the residuals (OLS = ordinary least squares), I minimized Sum[(residual/value)^2]. I.e., I minimized the squares of the relative errors rather than the squares of the absolute errors. The latter is only appropriate when the error is expected to be independent of the size of the data (as is found in homoskedastic data). However, I've found that, more typically, the error increases in proportion to the size of the data. If I were being paid to do this I would have done a formal test of the distribution of the residuals. But since I'm not, I just did both and determined which gave the better-looking fit (or if they were comparable, I stuck with WLS for consistency). With this approach, I ended up using WLS for everything (not that it made much of a difference in these cases -- the visual differences between the two are subtle).
 

Jimmyjames

Site Champ
Posts
675
Reaction score
763
I saw this too, and I am unclear as to what it means - is his point that the benchmarks false report 3.6GHz because they only sample the frequency once? I don’t know how the benchmark tools work, but that would be weird.
I have a sneaking suspicion that actually is @leman!

I think he’s saying the A17 only stays at 3.78 for a few seconds before dropping to between 3.5 and 3.6ghz. People have been working out the IPC improvements on the 3.78 figure, when in fact they should have been using a lower figure…I think. Ultimately he’s saying IPC improvement is higher than the ~3% quoted.
 
Last edited:

dada_dave

Elite Member
Posts
2,164
Reaction score
2,148
I have a sneaking suspicion that actually it @leman!

I was wondering that myself :)
I think he’s saying the A17 only stays at 3.78 for a few seconds before dropping to between 3.5 and 3.6ghz. People have been working out the IPC improvements on the 3.78 figure, when in fact they should have been using a lower figure…I think. Ultimately he’s saying IPC improvement is higher than the ~3% quoted.
That's what I was thinking, but wasn't sure. The only thing is benchmarks are also often short, unless they are run in succession. Lots of unknowns here.
 

leman

Site Champ
Posts
641
Reaction score
1,196


@leman what do you think?

That’s literally what I think 😂 You are quoting my post on mastodon

I saw this too, and I am unclear as to what it means - is his point that the benchmarks false report 3.6GHz because they only sample the frequency once? I don’t know how the benchmark tools work, but that would be weird.

It seems that GB reports the peak frequency, but I think it’s very unlikely that the CPU actually can maintain it for more than a second or two. As I wrote on mastodon, I see A17 dropping to 3.5-3.6 GHz after 5-10 seconds. A16 clocks are more stable over time, at least on some submitted results. It’s all really fussy though, we need more data.
 
Last edited:

Jimmyjames

Site Champ
Posts
675
Reaction score
763
At any rate, as a very rough estimate we can take the 3100 GB6 points obtained by Geekerwan and their fancy cooling device. Let’s assume this is indeed what the chip can do while maintaining the peak frequency of 3.77Ghz. The highest A16 score I’ve seen is 2660, let’s make it 2700 to be conservative. A16 runs at 3.46Ghz. This gives us an IPC increase of 5-6%. Obviously, these numbers are very fragile and don’t mean much but IMO they make more sense. It would be really helpful to have a high-resolution performance counter readout for the entire duration of the benchmark…
Did Geekerwan say 3100 GB6? I thought it was ~3000.
 
Top Bottom
1 2